What is Data Analysis and What Can It Be Used For?

Data Analysis
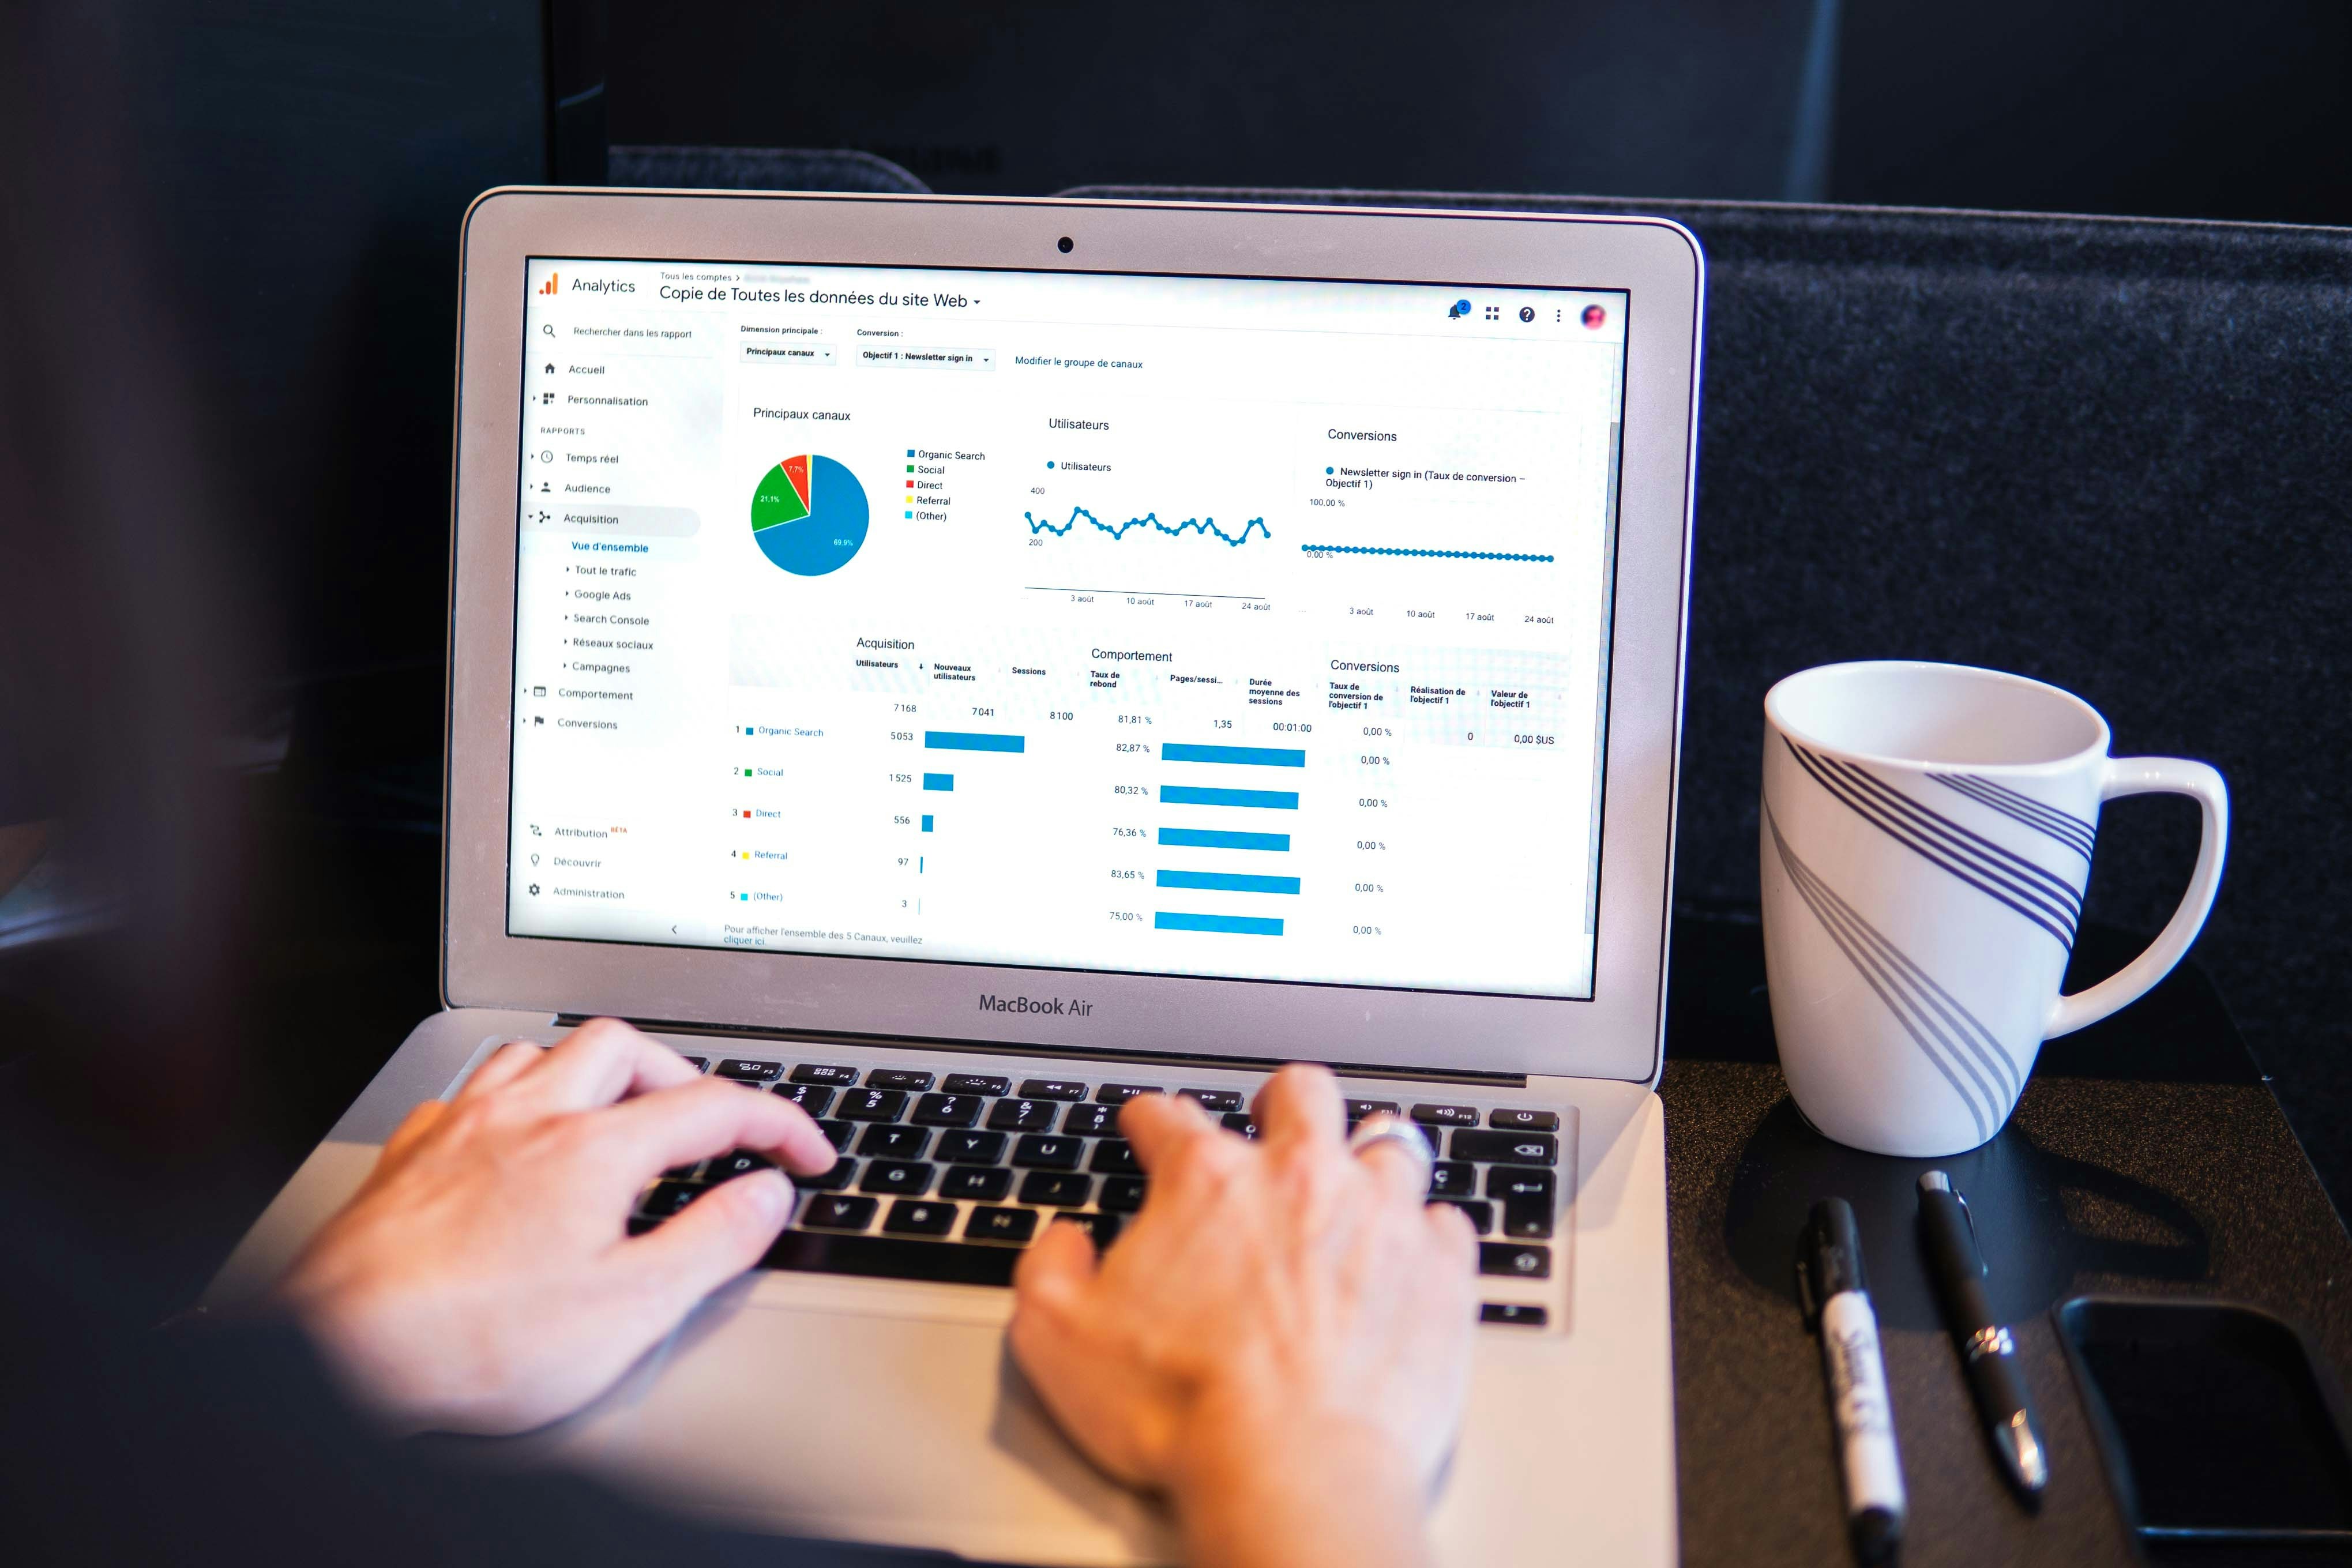
Data Analysis is a process of examining, cleaning, transforming, and modeling data to discover useful information, make conclusions, and support decision-making. It’s like turning raw data into meaningful insights that can drive actions. Whether you’re a business owner, a marketer, or just someone interested in improving your decision-making, data analysis can play a significant role in your success.
Why is Data Analysis Important?
In today’s world, data is everywhere—from the sales figures of your business to the feedback customers leave on social media. But raw data by itself doesn’t mean much. Without proper analysis, it’s like having all the ingredients for a delicious meal but not knowing the recipe. Data analysis helps you understand patterns, trends, and relationships in your data so you can make informed decisions that are based on facts, not just guesses.
Areas Where Data Analysis Can Be Applied
1. Business Decision-Making
- Example: Imagine you own a retail store. By analyzing sales data, you can identify which products are the best-sellers, what times of the year sales peak, and which customer segments are the most profitable. This helps you make better decisions on inventory, marketing, and customer engagement.
2. Marketing
- Example: Through data analysis, marketers can measure the effectiveness of their campaigns. By looking at metrics like click-through rates, customer demographics, and conversion rates, you can fine-tune your marketing strategies to target the right audience with the right message, leading to higher returns on investment (ROI).
3. Healthcare
- Example: In healthcare, data analysis can be used to predict outbreaks of diseases, personalize patient treatment plans, and improve the overall efficiency of healthcare services. For instance, analyzing patient data can help doctors identify patterns in symptoms and outcomes, leading to better diagnoses and treatment plans.
4. Finance
- Example: Financial analysts use data analysis to assess the performance of investments, predict market trends, and manage risks. By analyzing financial data, such as stock prices, interest rates, and economic indicators, they can provide valuable insights that guide investment decisions.
5. Education
- Example: In education, data analysis helps in tracking student performance, identifying areas where students struggle, and developing personalized learning plans. For example, a school can analyze test scores to find out which subjects students are finding most difficult and adjust teaching methods accordingly.
6. Government and Public Policy
- Example: Governments use data analysis to improve public services, develop policies, and manage resources. By analyzing data on crime rates, traffic patterns, or public health, officials can create more effective policies and allocate resources where they are needed most.
7. Sports
- Example: In sports, data analysis is used to improve team performance, scout talent, and even predict game outcomes. Coaches and analysts examine player statistics, game footage, and opponent strategies to develop winning game plans.
How Data Analysis Can Be Applied
8. Data Cleaning: The first step in data analysis is ensuring the data is accurate and free of errors. This might involve removing duplicates, correcting errors, or filling in missing information.
9. Descriptive Analysis: This involves summarizing the data to understand what has happened in the past. For example, a company might use descriptive analysis to look at sales trends over the past year.
10. Predictive Analysis: This goes a step further by using data to forecast future outcomes. For instance, a retailer might use predictive analysis to determine how much stock to order for the upcoming holiday season based on past sales data.
11. Prescriptive Analysis: This type of analysis suggests actions you can take based on the data. For example, a bank might use prescriptive analysis to recommend the best financial products for their customers.
12. Data Visualization: This involves presenting data in visual formats like charts, graphs, and dashboards. Visualizing data makes it easier to spot trends, patterns, and outliers that might not be immediately obvious from raw data.
Why Should You Learn Data Analysis?
Learning data analysis equips you with the skills to make smarter decisions, solve complex problems, and add value to any organization. In Nigeria, where the business environment is becoming increasingly competitive, the ability to analyze data can set you apart from others. Whether you’re running a small business, managing a team, or looking to advance your career, data analysis is a powerful tool that can help you achieve your goals.
Our Data Analysis Course at Exelsor Projects is designed to give you practical, hands-on experience. You’ll learn how to collect, clean, and analyze data using tools like Excel, Python, and SQL. More importantly, you’ll understand how to apply these skills in real-world situations, whether it’s in business, marketing, healthcare, or any other field.
Conclusion
Data analysis isn’t just about crunching numbers; it’s about making sense of the world around you. It helps you turn data into actionable insights that can drive success in any area. If you’re ready to unlock the power of data, our course will guide you every step of the way, providing you with the knowledge and skills you need to excel.
Sign up today and start making data work for you!